Junior/Intermediate Math Lessons
Alphabetical Statistics: Part 1
Image
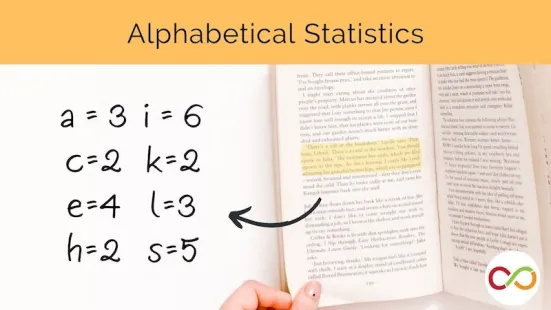
Using excerpts from books, students predict, collect samples, and compare their findings to make statistical inferences about larger sets of data.
Beat The Odds
Image
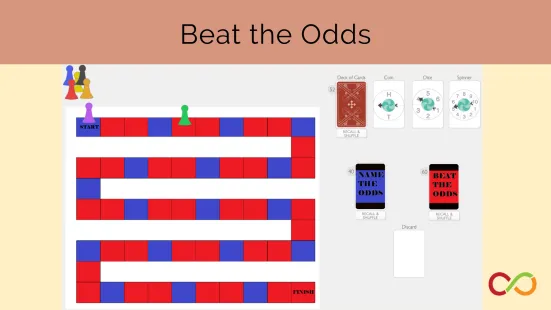
Get students thinking about experimental versus theoretical probability as they try to beat the odds in this board game!
Card Collectors
Image
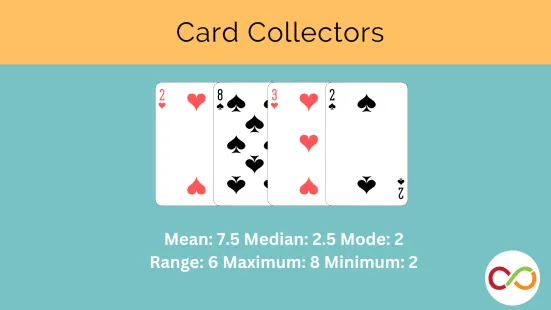
Students work in teams to determine the maximum, minimum, mean, median, mode and range of a group of playing cards.
Chain Game
Image
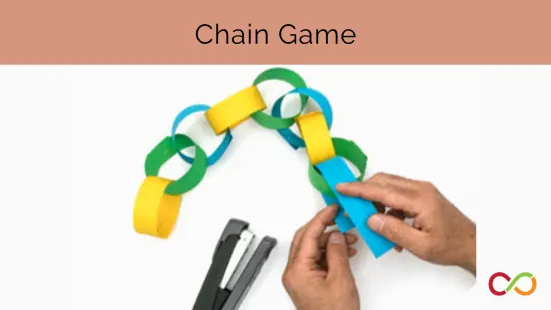
Students create a product that can be sold/traded on the “world market.” Soon enough, the market changes!!
Comparing Food Prices: Food Insecurity Part 1
Image
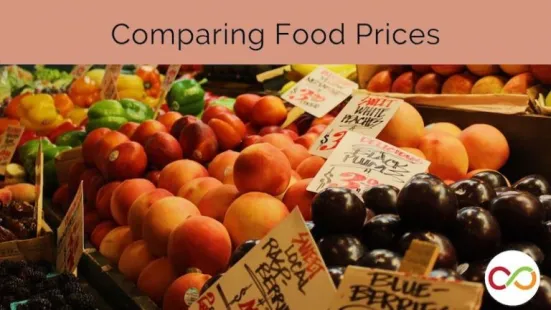
Students use math to explore how explore the factors that influence one’s ability to access food.
Dragon’s Den in the Classroom
Image
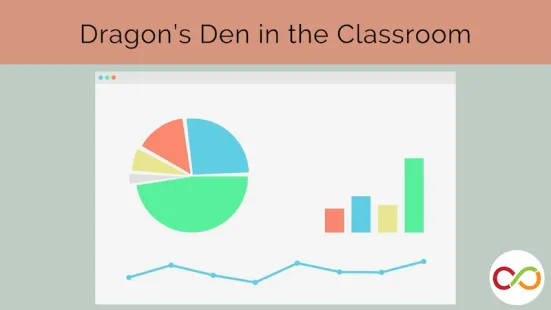
Students use data as evidence to convince a panel of judges that their project will be profitable.
Food Prices in Remote First Nations: Food Insecurity Part 2
Image
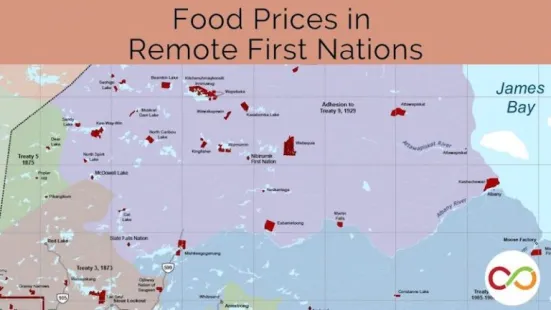
Students compare the average cost of everyday food items found in the Greater Toronto Area with Attawapiskat.
Historical Figures in One Minute
Image
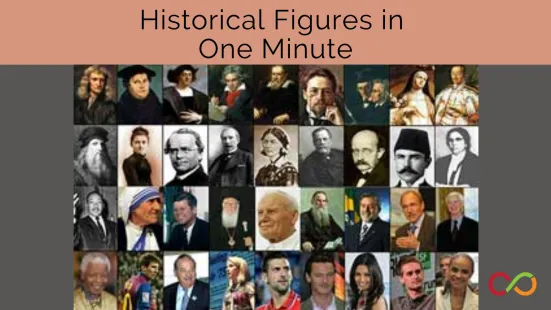
Students generate and analyze data to reveal issues of power, racial and gender inequality.
Mahjong
Image
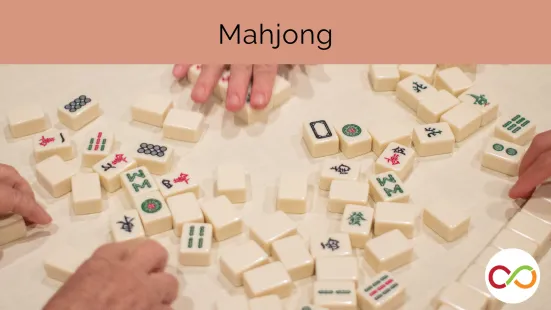
Using Mahjong tiles, students practice their combinational thinking by creating various sets to win the game.
Odds
Image
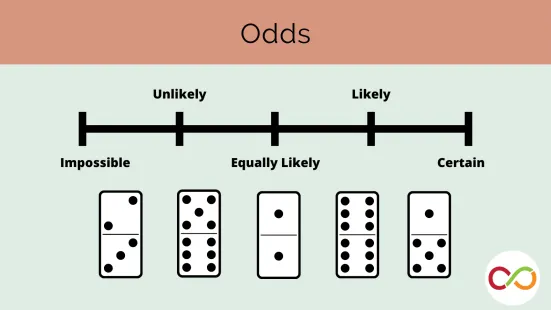
Using a probability line, students will make predictions informed by the likelihood of selecting a domino that is greater, equal, or lesser to the one in their hand.
Probability PIG
Image
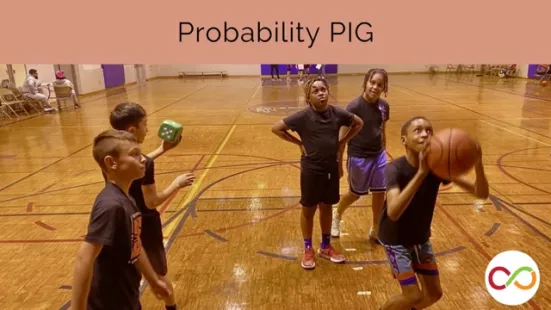
In this game, students take shots while incrementally increasing their distance from the net.
Simulating Resource Sharing
Image

This lesson explores what happens when individuals act only in their best interests to get the greatest number of fish. The simulation will allow students to see the different possibilities of working together to conserve resources.
Skunk
Image
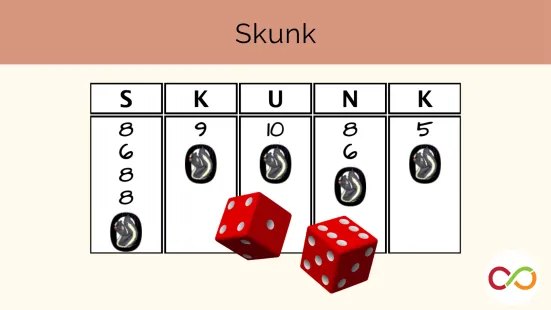
Using probability, students must choose between locking in their points or gambling for a higher score.
Using maps and investigating catch rates to understand lobster abundance in Nova Scotia waters
Image

Once students better understand the species, they can explore the interaction between lobsters and fishers.
