Primary Math Lessons
Alphabetical Statistics: Part 1
Image
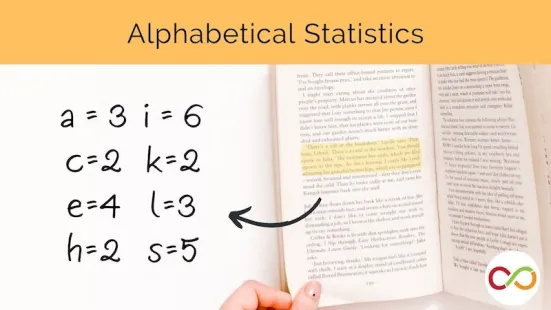
Using excerpts from books, students predict, collect samples, and compare their findings to make statistical inferences about larger sets of data.
Alphabetical Statistics: Part 2
Image

Using excerpts from books, students predict, collect samples, and compare their findings to make statistical inferences about larger sets of data.
Card Collectors
Image
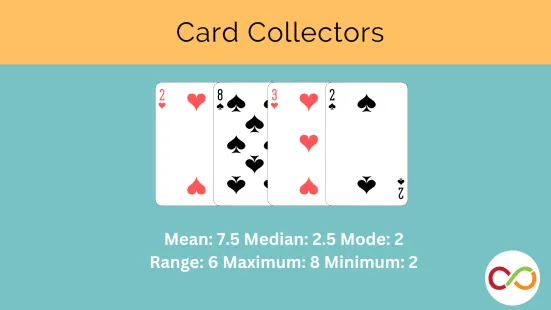
Students work in teams to determine the maximum, minimum, mean, median, mode and range of a group of playing cards.
Circle to Bar Graph
Image
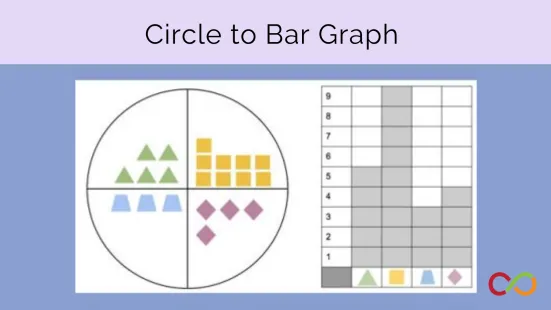
What is easier to read - a circle graph or a bar graph? Children discover the answer in this lesson.
Daily Calendar
Image
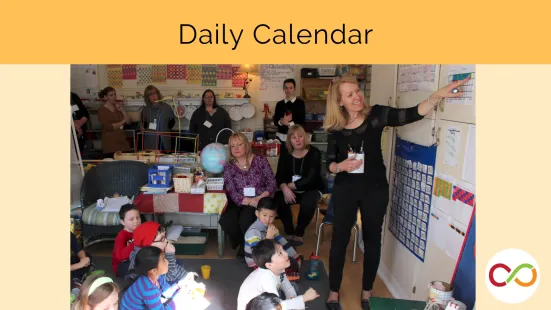
This daily lesson with many small activities gives students the opportunity to practice all five strands of math every day.
Dice Toss
Image
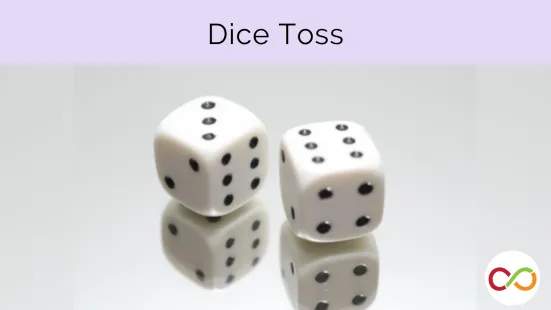
Students engage in a simple probability experiment that requires dice and mental math strategies.
Graphs on Paper
Image
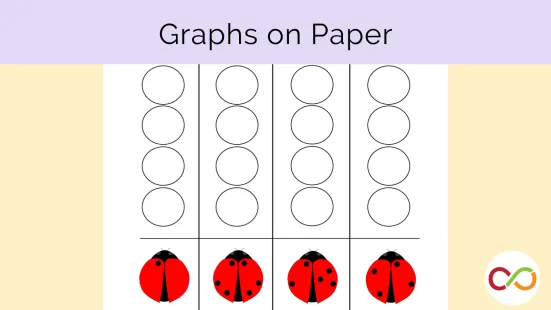
Students practice precise graphing skills by using a graphing package to sort and classify objects.
How Many Seeds in a Pumpkin?
Image
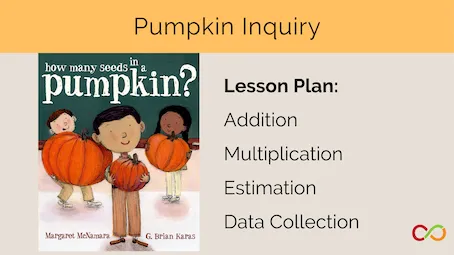
Explore addition, multiplication, data management, and the relationship between size and capacity.
Introduction to Graphing
Image
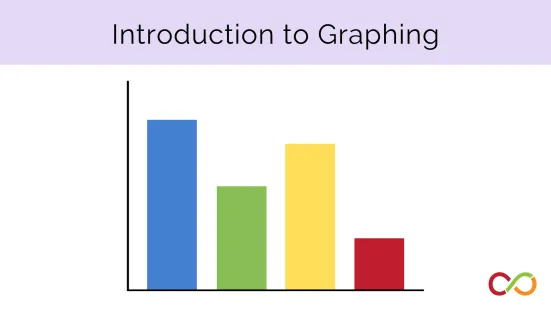
Children use previous sorting lessons to make a graph, realizing there is a clear way to display data.
Introduction to Venn Diagrams
Image
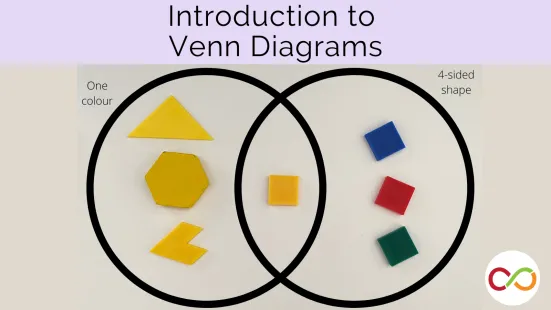
Introduce students to one of the essential hallmarks of elementary data management: the Venn Diagram.
Smarties Graph
Image
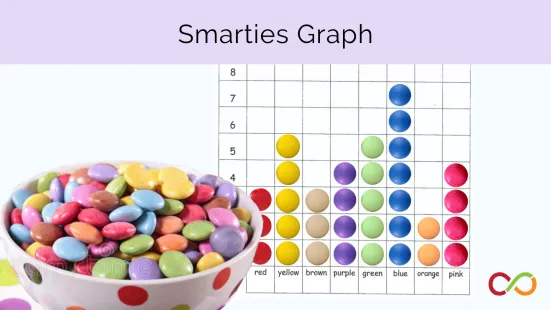
Every box of Smarties contains a different amount of each colour. Children graph what their box contains.